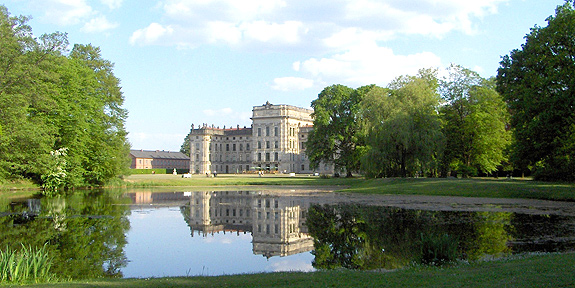
Ludwigslust Palace
About MagicElbe
This historical animation of 1994 shows the salinity dynamics of a 3D numerical simulation of a normal tide in the Elbe estuary, Germany. It ranges from zero psu (fresh water coming from the weir in Geesthacht) up to 25 psu at Yellow Sand (upper left boundary, German Bight). The upper panel presents a dynamic view of a vertical section through the river along the navigation channel. The lower panel shows a dynamic 2D birds view of the estuary (in the upper layer of the 3D results), and the right panel gives the salinity scale in practical salinity units [psu]. This sort of dynamic inter-disciplinary information system has been developed together with Stefan Zabanski. The 3D hydro-numeric code used here is a result of the PhD thesis (1989) of Kurt Duwe, today associated with (and founding member of) our partner Hydromd GbR.
The upper panel allows to observe the salt wedge moving back (ebb current, with visibly strong haline stratification) and forth (flood current, with a vertically well-mixed water column) with the tide.
This problem has been studied in some detail with respect to the turbulent kinetic energy together with Günther Radach (Baumert & Radach, 1992)
and later with respect to the so-called turbidity maximum, typical for meso- and macro-tidal estuaries together with Hans Burchard (Burchard & Baumert, 1998).
Here we have two options:
• The full model domain from weir Geesthacht (South-East) to Yellow Sand (North-West) in the German Bight including Hamburg city and its port region, and
• The enlarged lower Elbe from Yellow Sand in the North-West to (almost) Brunsbüttel.